Earlier this week I almost deployed a trading strategy that returned +2,053% over 8 years while passing every standard validation test. By the same evening, I had retired it. The number didn't lie — but it also wasn't an edge. It was a lottery ticket I would have paid to convert into a real strategy.
The test that caught the deception is one most retail traders have never heard of, and most professional shops only run intermittently: parameter robustness in a neighborhood.
If you only learn one new technique from this article, learn this one. It will save you more money than every other backtest improvement combined.
What "Parameter Robustness" Actually Means
Almost every trading strategy has at least one tunable parameter. Some examples:
- A momentum strategy: how many days back do you compare today's price to? (Lookback)
- A moving-average crossover: how many days for the fast MA, how many for the slow MA?
- A breakout strategy: how many days for the rolling high?
- An RSI strategy: what's the oversold threshold? Overbought?
- A Bollinger band strategy: how many standard deviations?
When you backtest, you typically pick specific values for these parameters. Maybe 14-day RSI, oversold at 30. Maybe 50-day fast MA, 200-day slow MA. Maybe 20-day momentum lookback.
The question parameter robustness asks: do nearby parameter values produce similar results?
A real edge has a smooth response surface. If 14-day momentum works, 13-day and 15-day should also work — maybe slightly worse, but in the same neighborhood. If only 14 days works and 13/15 don't, what you've found isn't a "14-day edge." You've found one specific number that happened to align with the noise pattern of your historical data.
That's not skill. That's pattern-matching luck.
The Visual Intuition
Imagine plotting strategy return on the y-axis and parameter value on the x-axis. There are two characteristic shapes:
The Plateau (real edge)
Return
  ^
  |       ___________
  |      /           \
  |     /             \
  |    /               \
  |___/                 \___
  +-------+-------+-------+----> Lookback
       12  13  14  15  16
Multiple adjacent parameter values all produce strong returns. The exact choice within the plateau doesn't matter much. This is what an actual edge looks like — the underlying signal works across a range of parameter values, with one being marginally better than its neighbors.
The Spike (lottery)
Return
  ^                |
  |                |
  |                |
  |                |
  |____  __  _____ | _ ____
  +-------+-------+|+-----+----> Lookback
       12  13  14  15  16
One parameter value spikes dramatically while the neighbors are flat or low. This is what overfitting to historical noise looks like — the value happened to align with random patterns in your specific dataset, but doesn't reflect any underlying market structure. Move one tick away and the "edge" vanishes.
If your backtest looks like the spike, the most likely explanation is coincidence, not insight.
A Real Example From Last Week
I tested 17 momentum-based BTC trading strategies on 8 years of daily data. The winner: a 14-day momentum lookback. Numbers below.
Continuous backtest, full 8 years:
- Total return: +2,053% (vs HODL +654%)
- Max drawdown: -52%
- Trades per week: 1.01
- Walk-forward (3 sub-periods): 3 of 3 windows beat HODL
That's a great looking result. Three out of three walk-forward windows is the gold standard. Beating HODL by 1,400 percentage points is staggering. By every standard validation test, the strategy was a clear deploy.
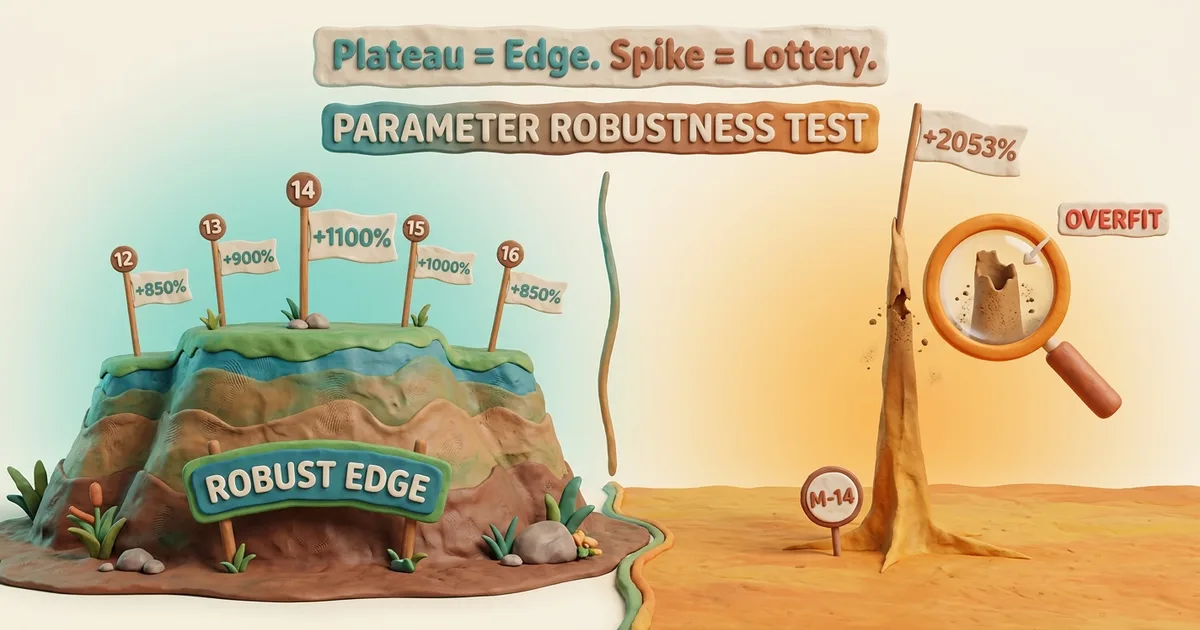
Then I ran the parameter sweep:
| Lookback | Full Return | Walk-Forward |
|---|---|---|
| M-12 | +665% | 1/3 |
| M-13 | +437% | 1/3 |
| M-14 | +2,053% | 3/3 |
| M-15 | +768% | 1/3 |
| M-16 | +662% | 1/3 |
That's a textbook spike. M-14 is three to five times better than its immediate neighbors. The 13-day and 15-day variants — which differ by a single day — score 1 of 3 walk-forward, not 3 of 3. Same data, same construction, totally different result.
The honest reading: the M-14 result is generated by the specific noise pattern of 2018-2026 BTC happening to align with the 14-day lookback — not by any underlying market structure that 14 days captures particularly well.
I retired the strategy that morning. Full post-mortem here.
Why Walk-Forward Alone Isn't Enough
Walk-forward (testing on independent time windows) is a strong test. It catches strategies that worked in one market regime and broke in others. Most "back-tested winners" online fail walk-forward because they were tuned on a specific period and never validated out-of-sample.
But walk-forward and parameter robustness check different failure modes:
| Test | Failure mode it catches |
|---|---|
| Walk-forward (3 windows beat benchmark) | Regime overfitting — strategy worked in one era only |
| Parameter robustness (neighbors agree) | Noise overfitting — specific param value lucky-matched random patterns |
A strategy can pass walk-forward and still be noise-overfit. It can produce real returns in three independent sub-periods if those returns come from accidentally aligning with random patterns in each sub-period — patterns that have similar shape but no underlying causal mechanism.
When the parameter-sensitivity test then shows the result depends critically on one specific number, with no support from neighbors, the most likely explanation is coincidence accumulated over enough opportunities. Test 17 momentum lookbacks across 8 years; one of them is going to look great by chance even if no real edge exists in the strategy class.
The walk-forward test is necessary but not sufficient.
The Three-Test Validation Stack
Here's the validation order I now run on every new strategy:
Test 1: Continuous backtest
Does the strategy produce positive returns over the longest data window you have, after realistic fees?
If no → strategy is broken in obvious ways. Move on. If yes → proceed.
This filters maybe 50% of ideas. (Most fail because they don't beat HODL after fees.)
Test 2: 3-window walk-forward
Split the historical data into 3 non-overlapping windows. Test the strategy independently in each. Does it beat the benchmark (HODL or appropriate index) in each window?
If less than 2/3 → regime-overfit. Don't deploy. If 2/3 or 3/3 → proceed to Test 3.
This filters another 30% of remaining ideas. (Many "winners" only worked in one regime.)
Test 3: Parameter neighborhood sweep
For your chosen parameter (or each parameter if multi-dimensional), test ±2 to ±5 nearby values. Does the chosen value sit in a plateau of similar results, or is it an isolated spike?
If neighbors disagree dramatically (return varies 3x+ within ±2 ticks) → noise-overfit. Don't deploy. If neighbors form a smooth plateau → likely real edge. Consider deploying.
This filters another 80% of what's left after Test 2. The combined filter rejection rate is roughly 95% of all backtest-positive strategies.
If something passes all three filters, it's worth paper-trading. Not deploying real capital — paper-trading. Real-money decisions still require live track record beyond any backtest.
Why Almost Nobody Runs Test 3
Three reasons it gets skipped:
1. It's slow
Running a 17-parameter sweep takes 17x as long as one backtest. Walk-forward takes maybe 3x. Continuous backtest is one run. The sweep is the most expensive of the three by an order of magnitude. People with limited compute or limited patience cut corners.
2. It produces uncomfortable results
When the sweep shows your "great backtest" is a spike, you have to throw the strategy away. You spent days building it. Throwing it away feels like wasted work. (It's not — the work generated knowledge, just not a deploy candidate. But emotionally it stings.)
3. Pop trading literature doesn't teach it
The standard backtest tutorial on YouTube or Medium teaches: pick your strategy, pick your parameters, backtest, look at the equity curve, deploy. Some advanced tutorials add walk-forward. Almost zero teach parameter robustness as a mandatory check. Trader culture optimizes for "look at the cool result" rather than "show me the failure modes you ruled out."
The result: the same overfit strategies keep getting "discovered" and deployed by retail every cycle. The same tools that found Sharpshooter found a thousand similar lottery tickets across thousands of users.
The Practical Sweep You Can Run In 5 Minutes
If you have ANY backtest framework:
- Take your "winning" strategy with parameter X
- Re-run the backtest with parameters X-2, X-1, X, X+1, X+2 (and ideally a wider range)
- Tabulate: full return, max drawdown, walk-forward score for each
- Plot the response or read the table
If the table looks like a smooth curve → green light, considered deployment. If the table looks like a single spike → red light, you found noise.
That's literally the entire test. One afternoon of backtest re-runs. Saves you from deploying lottery tickets.
The Mental Discipline
Here's the part nobody talks about: the biggest enemy of running parameter robustness is YOU after you find a great backtest.
When the continuous backtest shows +2,053% return, your brain wants to deploy. The dopamine response from "found an edge" is large. Running an additional check that might invalidate the result feels like sabotaging your own discovery.
The mechanical defense: make parameter robustness a non-negotiable step before any deploy decision. Same way Test 1 and Test 2 are non-negotiable. You don't get to skip a step because the previous step looked good. The tests filter different failure modes. Skipping any of them means accepting a higher rate of deploying lottery tickets.
I almost skipped this test on Sharpshooter. The result was so clean I caught myself thinking "this one is obviously real, the sweep is just confirmation." That sentence is the exact moment overfit strategies get deployed in the real world. The sweep is never just confirmation. It's the most important of the three tests because it's the only one that catches noise-overfitting.
If you make a habit of running it on every result that excited you, you'll deploy fewer strategies and outperform people who deploy more. Less is more in this part of the process.
Related Reading
-
Methodology page — The 3-test stack this article describes, in pillar form
-
The Sharpshooter Post-Mortem — the real story this article generalizes
-
Beat HODL or Don't Bother — the benchmark that strategies must clear
-
10 Backtest Biases Pillar — the methodology series this complements
-
Overfitting Bias — the parent category
-
Data-Snooping Bias — testing many configurations and showing the best
-
Post-Mortems Ledger — every retired strategy with its specific failure reason
Not financial advice. Past performance does not guarantee future results. The validation stack described here reduces — but does not eliminate — the probability of deploying broken strategies.


