It's April 14, 2026. 8:47 PM. My colleague Sandra sends me a screenshot.
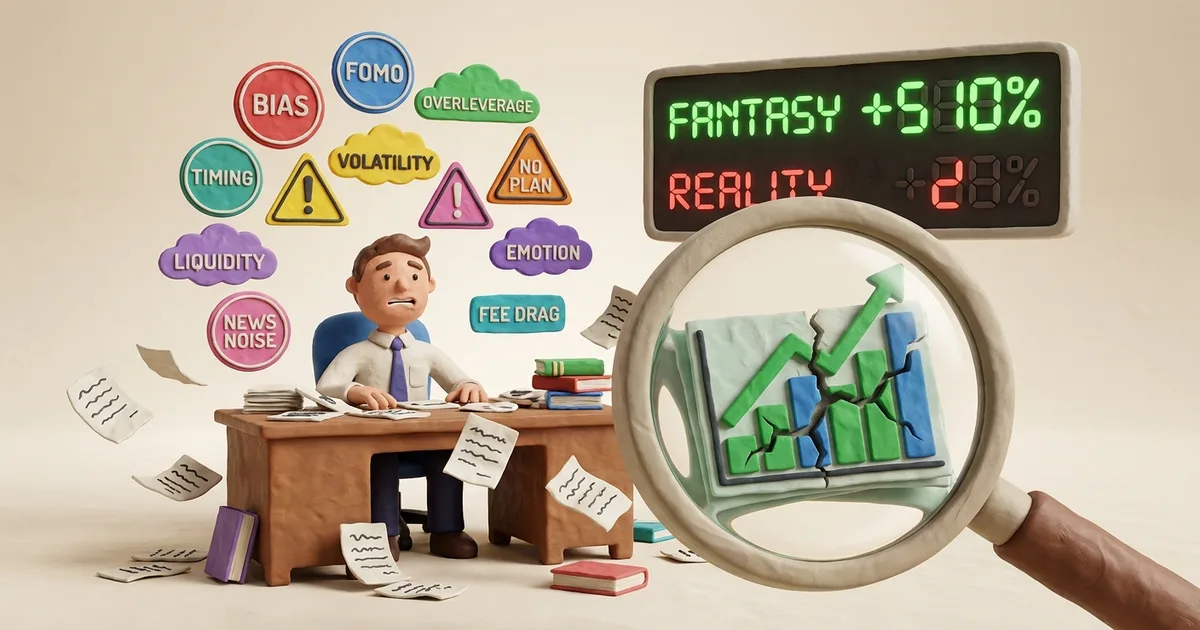
"Look at this, Dom. If I'd run my strategy the last 11 years, I'd be up +510 percent."
She's holding her phone up in a Zurich café. Two glasses of wine on the table. A spreadsheet on the screen. Fifteen US stocks. Netflix, Meta, Broadcom, Visa. All green. All beautiful.
She's proud. She has every right to be.
I looked at her numbers. I checked the math. Clean. I tested the execution rules on my own machine. Same result: +510% over 11 years. $12.6 million in paper profits on $2.5 million deployed.
Then I ran the honest test.
+28.5%.
Not a typo. Twenty-eight point five percent over seven years. Roughly 3.6% per year. The S&P 500 did about 17% annually in the same period (+212% total). Her strategy lost to the most boring thing on Earth: a passive index fund.
What happened?
Her strategy did not change. Her discipline did not change. The rules were identical. The one thing that changed: I stopped cheating.
This article is about how backtests lie. Every single one of them, unless you know what to look for.
And in the end, I'll tell you what actually worked. Because I found real alpha. Boring, simple, and frankly, a little embarrassing in how obvious it is.
Buckle up.
Why Am I Telling You This?
Because Sandra is not an idiot. She is a smart, disciplined investor. Her selection process is good. Her execution is good. Her psychology is good.
And still, her backtest was a lie.
If it can happen to her, it can happen to anyone. It can happen to you. It has almost certainly already happened to every YouTuber showing you a "proven strategy" with a hockey-stick chart.
In this article, I'll show you:
- The 10 tactical biases that turn losing strategies into winning backtests
- The meta-bias — the one sitting under all the others, the one no backtest can fully escape
- Why Sandra's +510% shrunk to +28% when I tested it honestly
- The one strategy that beat the S&P 500 by +530 percentage points over the same 7 years
- And why it took me eight failed variants to stop fooling myself
Each bias gets a quick explanation here, with a link to its full deep-dive. All 10 tactical deep-dives are now published; the meta-bias is linked at the end. The 12 behavioral biases — the ones that trip up humans even when the math is right — are covered in their own pillar: Why You Are Your Own Worst Enemy. Our complete bias curriculum: 10 methodology + 1 meta + 12 behavioral = 23 biases.
Let's go.
Bias #1: Survivorship Bias — The Ghost of Dead Companies
Sandra picked her 15 stocks in April 2026. Netflix, Meta, Broadcom, Axon, CrowdStrike, Spotify, Oracle, Visa. She didn't pick Sears. She didn't pick WeWork. She didn't pick Peloton.
Why? Because in 2026, we all know those are losers. In 2015, nobody knew. Some of those names were darlings in 2015. A 2015-Sandra using 2015 information would have picked some of them. Some would have crashed 80%. Some would have gone bankrupt.
Her 2026 list is a ghost universe. Every name survived. Every name is a winner. By definition.
When I ran Sandra's strategy on a rolling quality screen (picking the top 10 stocks with honest 2019 data, then 2020, then 2021, and so on), the return collapsed from +510% to +28.5%. That 482 percentage point gap IS survivorship bias.
Remember: If you handpicked your test stocks today, your backtest includes a decade of hindsight you didn't have back then.
Deep dive: How Sandra's 14 Winners Hid 12 Losers — how to measure survivorship bias in any portfolio test.
Bias #2: Look-Ahead Bias — Knowing Tomorrow's Newspaper
In my third Sandra test, I used Claude to rank companies by quality. Claude read the financials, the business descriptions, the management bios. It gave each one a moat score and a management score.
The problem? Claude's training data extends into 2025. Claude KNOWS that NVIDIA became the AI king. Claude KNOWS that Netflix survived the 2022 subscriber crisis. Claude KNOWS everything that happened up to its cutoff.
Even when I told Claude "evaluate this company AS OF January 2019," it couldn't un-learn. It's like asking a friend who saw the sports results to bet on the game anyway.
The symptom? Claude-enhanced backtest: +27.1%. Plain quantitative backtest: +28.5%. Claude's "knowledge" didn't help. Either because it's not real edge, or because the hindsight was baked into both tests equally.
Remember: Any backtest using data or models that have seen the future is contaminated. Even slightly.
Deep dive: Claude Knows Too Much — look-ahead bias in AI-powered strategies.
Bias #3: Hindsight Bias — "It Was Obvious, Wasn't It?"
Go look at NVIDIA's stock chart from 2015 to 2026. Up and to the right. Monster.
Now ask yourself: in 2015, was it obvious?
No. It wasn't. In 2015, NVIDIA was a gaming chip company. AI was a curiosity. Data centers were boring. Meta was still Facebook and struggling with mobile ads. Broadcom was a cable modem company.
Hindsight bias is the mental trap where you look at the outcome and conclude "this was inevitable." It wasn't. You just know how the story ended.
In trading, hindsight makes you over-trust stories that explain past returns. "Of course NVIDIA won, AI was coming." Coming when? How did you know? Did you buy it in 2016 at $4.50? No, you didn't. Nobody did. Jensen Huang himself almost sold NVIDIA to a competitor in the late 1990s.
Remember: Every obvious winner was once a weird bet. Every weird bet you missed was once obvious to someone.
Deep dive: The "Obvious" Winners Nobody Bought — how hindsight warps your confidence.
Bias #4: Overfitting — The Bot That Memorized the Answers
Last week, I ran 23 trading bots on 16 months of Bitcoin data. The Volume Spike Bot came out on top: +45.7%.
I extended the test to 6 years.
Result: -27.6%.
Negative. It lost money across a full market cycle. What happened? The bot's parameters were tuned (by me, unconsciously) to patterns that existed in 2024-2025. Those patterns don't generalize. A new market regime broke them.
Overfitting happens when your strategy is so perfectly shaped to past data that it memorizes instead of learns. Like a student who memorizes the test answers. Perfect score. Next semester's test: disaster.
The cure isn't more conviction. It's more data. Always test on periods the strategy never saw during design.
Remember: A strategy that fits your test period perfectly will fit the next period poorly. The more parameters, the worse it gets.
Deep dive coming: Our Best Bot Was a Lie — already published, a case study in overfitting.
Bias #5: Cherry Picking — The Billionaire Who Only Shows You His Wins
Every trading course on YouTube starts the same way. "I tested this on the 2022 bear market. It made money." Or "I tested this on the COVID crash." Or "Look at 2020-2021, it crushed the market."
Notice what they never do? Test it across ALL periods. Because if they did, the average would be ugly.
Cherry picking is selecting time windows that make your strategy look good. It's the trading equivalent of showing you the highlight reel and hiding the bloopers.
A real test covers at least a full market cycle. Ideally two. Bull, bear, sideways, panic, recovery. If your strategy only works in one of those regimes, it's not a strategy. It's a regime bet.
Remember: If a backtest skips the 2008 crash, the 2022 bear, or the COVID panic, it's not a backtest. It's a pitch deck.
Deep dive: The YouTube Guru Who Only Shows You 2020 — how to spot cherry-picked timeframes.
Bias #6: Confirmation Bias — Only Saving What You Like
I'll confess something ugly. In my first Sandra tests, I built eight variants. v2.0, v2.1, v2.2, all the way to v2.8. Each one tweaked a different element.
v2.0 was mediocre (+180%). v2.2 was worse (+22%). v2.6 was the worst (+11%).
If I had stopped at v2.1 (+510%), which was the best, and written a blog post titled "I Built the Perfect Strategy," I'd be lying to you. Not because the number was fake. Because I'd be hiding the seven other variants that failed.
Confirmation bias is the mental tendency to remember your hits and forget your misses. In trading, it means you save only the backtests you like. Delete the rest. Repeat until you've "proven" what you already believed.
The cure: save every test. Publish the losers with the winners. If you're embarrassed to show someone your dead strategies, you haven't learned from them.
Remember: The strategies you didn't publish tell you more about edge than the ones you did.
Deep dive: I Built 8 Strategy Variants. 6 Failed. — why I publish my losers.
Bias #7: P-Hacking — Test Enough, Something Will "Work"
Here's a cute statistical fact. If you test 20 random strategies against the market, roughly 1 will look statistically significant by pure chance. Just coincidence. The p-value says "only 5% chance of random luck," but when you test 20 times, one of them is going to hit that 5%.
This is p-hacking. The academic name for "test until you find something that looks real."
In trading forums, you'll see this constantly. "I tested 50 strategies. This one beats the market." Yes, of course it does. Statistically, at least one should, even if they're all equally worthless.
The cure is out-of-sample testing. Design your strategy on one period. Then test it on a completely separate period you never touched during design. If it works on the untouched data, you have something. If it breaks, you were p-hacking.
Remember: If you keep tweaking until something "works," you haven't found a strategy. You've found a coincidence.
Deep dive: 20 Random Strategies. One Looks Brilliant. — how to catch yourself p-hacking.
Bias #8: Regime Bias — Testing Only on Bull Markets
From 2020 to 2022, Bitcoin went from $7,000 to $69,000. If you tested any "buy and hold" strategy in that window, it looked brilliant. Not because the strategy was brilliant. Because the regime was a rocket.
Regime bias is when your test window includes one specific market condition, and you mistake it for a universal truth. Works in bulls, dies in bears. Works in low volatility, dies when vol explodes.
Sandra's 2015-2026 test covered mostly a bull market in US equities. Brief corrections in 2018, 2020, 2022. But the overall regime: up. In a prolonged bear market, her strategy of "buy more on every 10% drop" would deploy capital into stocks that keep falling for years. Capital destruction.
You won't see this in the backtest. The backtest only shows you what happened. The stress scenario it never faced is still lurking.
Remember: A strategy that survived one regime has not survived all regimes. The market has more moods than your test period.
Deep dive: When Your Strategy Works in Bulls and Only Bulls — regime stress testing.
Bias #9: Recency Bias — "Last Year Worked, So Next Year Will Too"
Every January, the financial media crowns last year's winners. "Gold crushed it in 2024! Time to load up on gold!" "Tech stocks won in 2023! Here's the ETF to buy!"
The data says the opposite. Last year's best-performing sector is more likely than average to UNDERPERFORM the next year. It's called mean reversion, and it's one of the few reliable patterns in markets.
Recency bias tricks you into extrapolating short trends. You test a strategy that worked the last 6 months. You assume it'll keep working. Most of the time, it won't. Either the pattern ends, or everyone else noticed and arbitraged it away.
The cure is long time windows. If a strategy only looks good over the last 12 months, it's probably not a strategy. It's the last 12 months.
Remember: Recent performance is the weakest predictor of future performance. Duration of edge matters more than magnitude of recent wins.
Deep dive: Why Last Year's Winners Lose Next Year — the math of mean reversion.
Bias #10: Data-Snooping — Tuning Parameters Until It Fits
In my Sandra tests, I had parameters. The dip threshold (-20%? -15%? -25%?). The scaling factor (1.25x? 1.5x? 2.0x?). The stop-loss level (5%? 8%? 3%?).
Every time a backtest looked mediocre, I was tempted to adjust a parameter. Tune it until the curve looked nicer. That's data-snooping. Also called "optimization." Also called "fitting your strategy to the past."
If you tune 5 parameters across 20 possible values each, you have 3.2 million combinations. Somewhere in that haystack, you'll find a needle that makes your backtest beautiful. It will almost certainly not work in the real world.
The cure is parameter discipline. Set your parameters once, based on theory or intuition. Run the test. If it fails, don't tune. Acknowledge the theory was wrong. Start over with a different theory.
Remember: Every parameter you tune is a degree of freedom that overfits your test. Fewer parameters, more trust.
Deep dive: 3.2 Million Parameter Combinations — the snooping trap, visualized.
So What Actually Works?
I almost gave up on Sandra's whole category of strategy. After eight failed variants, after an honest +28% rolling test that lost to the S&P, I figured "quality investing is a myth, just buy the index."
Then I tested something else. Something almost insultingly simple.
Pure Momentum Top 10, monthly rebalanced.
The rules:
- Once a month, screen all US stocks with market cap above $10 billion
- Rank them by their return over the past 12 months (skipping the most recent month, academic standard)
- Buy the top 10, equal weight
- Next month, repeat. Sell anything that dropped out of the top 10. Buy whatever's new.
That's it. Five sentences. No fundamental analysis. No quality screen. No discretion. Just "hold the 10 stocks that rose the most recently."
Results over 7.3 years, out-of-sample, transaction costs included:
- +742% total return. Versus S&P 500 at +212%.
- +34% CAGR. Versus S&P at +17%.
- +530 percentage points of alpha. Net of fees.
Nine out of eleven momentum variants I tested beat the S&P. The effect is robust. It's documented since 1927 in academic literature (Fama, French, Asness). It works across countries, decades, asset classes.
Why does momentum work when "quality at a discount" doesn't?
Because "the recent winner keeps winning" captures something real. Investors under-react to good news. Analysts raise estimates gradually. Customers compound. Capital flows toward what's already working. A stock up 80% last year isn't at its "peak". It's at its acceleration phase.
Sandra's strategy does the opposite. It buys stocks that just fell 20%. That's swimming against the strongest current in markets.
The Honest Caveats
Momentum isn't free money. The drawdowns are brutal. My best variant had a maximum drawdown of -53%. That means a $100,000 portfolio briefly becomes $47,000. If you panic-sell at the bottom, the whole edge is gone.
Momentum also has bad years. 2008 was ugly. 2009 was ugly. 2018 was ugly. In those years, a momentum portfolio underperforms the market. You have to stay disciplined.
And there are practical frictions. 100-200 trades per year. At Swiss broker fees, that's roughly 1,500 CHF annually. Tax treatment in Switzerland depends on how the Steueramt classifies your activity: monthly rotation might be flagged as professional trading, which makes gains taxable. Talk to a tax advisor before implementing anything.
Remember: Momentum is real alpha, but it's painful alpha. The drawdowns filter out everyone who can't stomach them. That's exactly why it keeps working.
The Meta-Bias: The Induction Problem — The One Under All the Others
Ten tactical biases. A full methodology page. Walk-forward tests, parameter robustness sweeps, out-of-sample discipline. You apply all of it. You clean up your backtest like a surgical theater.
And there's still one bias left.
You're testing on the past. You're always testing on the past. Every single backtest, no matter how carefully designed, is a test of "what would have happened if the world that already happened had happened." The future is a regime draw from a distribution we've only partially observed.
A strategy that passes all 10 tactical tests could still fail the moment the world shifts into a regime our sample didn't cover. Central bank regime change. New correlation structure. A shift in retail participation. An unprecedented event.
This is the philosopher's old problem. Hume called it "the problem of induction": no amount of past sunrises logically proves tomorrow will bring another. Nassim Taleb rephrased it with his turkey, fed every morning for 1,000 days until the day before Thanksgiving.
We can't solve it. Nobody can. But we can:
- Keep real-capital strategies conservative
- Require live verification before any paper bot graduates
- Publish every failure honestly
- Never sell signals as forecasts
Deep dive: The Past Is Not the Future — why every backtest, no matter how rigorous, is still a bet on regime continuity. And what we do about it.
What This Means for You
Three takeaways if you only remember three things:
1. Every backtest you see is probably wrong. Not because the person is lying, but because at least one of the ten biases above is almost certainly hiding in the numbers. When you see a hockey-stick chart, assume it's inflated by 50-90% before you invest a cent.
2. The strategy that sounds the smartest is usually the worst. Sandra's quality-plus-dip-scaling sounds brilliant. It's sophisticated. It's intellectually satisfying. It loses to a passive index fund. Meanwhile, "buy the top 10 stocks that rose the most" sounds dumb. And it makes 3x the market.
3. Honest testing hurts more than dishonest testing. Every honest test I ran on Sandra's strategy destroyed a piece of my excitement. Every honest test made me a better investor. The pain is the tuition.
What's Next
All 10 tactical deep-dives are now live (linked inline above). The 11th — the meta-bias that sits under all of them — is here.
If you want the methodology these articles keep referring to, it's all on one page: the 3-test stack, the metrics we report, and why HODL is our anchor benchmark.
And the other half of the battle — the psychological biases that trip up human traders even when the math is right — has its own pillar: Why You Are Your Own Worst Enemy: 12 Behavioral Biases.
If you want to see the tools behind this article (the dashboard that screens US stocks by Sandra's 3-pillar quality model, the Claude-powered moat analyzer, the momentum top 10 live ranking), that's all in the BotLab and Live Bots pages.
Back in Zurich, my colleague and I are still talking about her strategy. She's a good investor. Her instincts are solid. But now she knows what her backtest was missing.
Hit reply if you have questions. I read every email.
Your Dominic, the guy who lost $12 million on paper so you don't have to.
Sources
- Fama & French (1992) — The Cross-Section of Expected Stock Returns
- Asness, Moskowitz & Pedersen (2013) — Value and Momentum Everywhere
- Jegadeesh & Titman (1993) — Returns to Buying Winners and Selling Losers
- Lo & MacKinlay (1990) — Data-Snooping Biases in Tests of Financial Asset Pricing Models
Disclaimer: This is not financial advice. All backtests are based on historical data. Past performance does not guarantee future results. The momentum strategy described here has significant drawdown risk and tax implications. Consult a licensed advisor before making investment decisions.


