A reader pushed back on me last week.
I had argued — strictly, in Beat HODL or Don't Bother — that every trading strategy must clear the HODL benchmark over its full backtest window. No exceptions. If your bot doesn't beat just-holding-the-asset over six years, you don't have a strategy. You have a hobby.
The reader said: "But that's tunnel vision. A bot trading 50 times a year doesn't operate on the same time horizon as 8-year HODL. The strict comparison can mislead."
Half wrong. Half deeply right.
The half that's wrong: HODL is still the right benchmark. I'll defend that below.
The half that's right: total return is just one number. Strategies have other dimensions that matter, and we under-reported them. This article fixes that. Plus a story about my car.
The Car Test
Imagine I'm trying to sell you a car. I tell you: "It does 280 km/h."
Cool. Buy?
Wait — what about fuel consumption? Maintenance cost? How comfortable on long trips? Cargo space? Reliability? Insurance? Resale value?
A car's "top speed" is one impressive number. It tells you almost nothing about whether the car is actually good for your life.
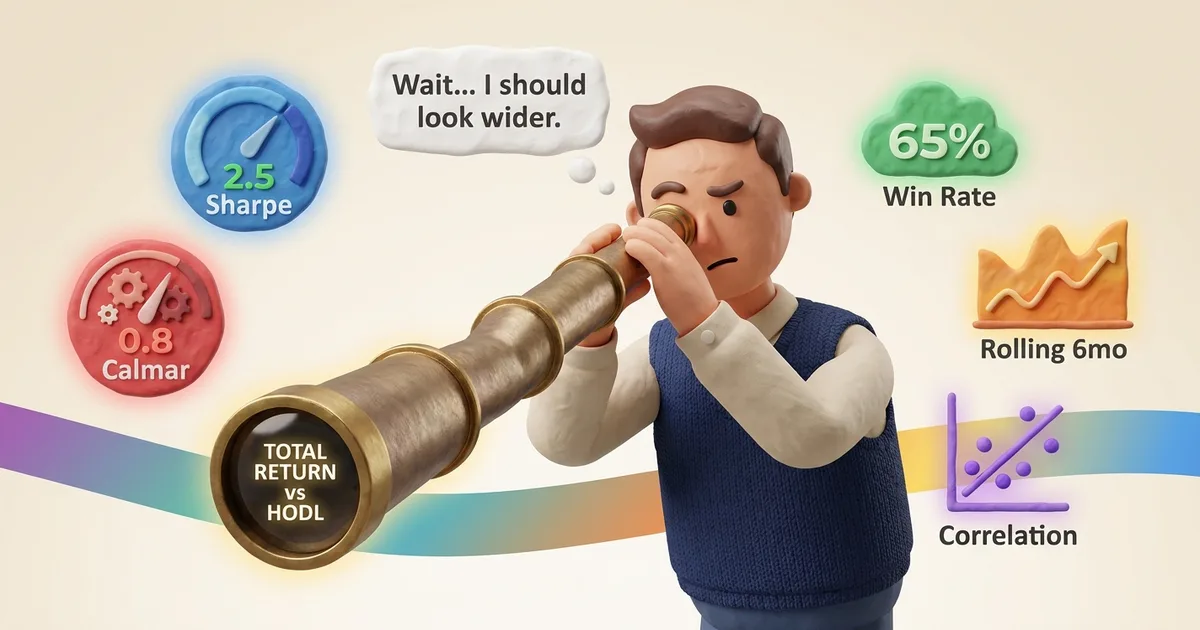
Trading strategies have the same problem. "Total return vs HODL" is the top-speed number. It's necessary. But it's not enough.
A bot that returns "+1,126% over 8 years vs HODL +603%" sounds great. But what about:
- How smooth was the ride? (or did it have brutal drawdowns?)
- How often did it actually beat HODL in the average year?
- How dependent is the result on a few lucky periods?
- What happens if I'd started yesterday instead of 8 years ago?
These are different dimensions. Some bots score great on all of them. Some look great on total return but fail on the others. We need to see all of them to judge fairly.
What Backtest Reports Usually Hide
Take our Tactician 2.0 over 8 years (the actual numbers):
- Total return: +1,126%
- HODL same period: +603%
- Verdict by total-return alone: Beats HODL by +523 percentage points
Sounds great. Now look at the same bot in three different time slices:
- Window 1 (2018-2020, mostly bear): bot beat HODL by +90 points
- Window 2 (2020-2023, recovery): bot beat HODL by +150 points
- Window 3 (2023-2026, current bull): bot LOST to HODL by -75 points
The +523 over 8 years is real. It's also heavily weighted by the first two windows. In the most recent two years, this bot has been losing to just-holding.
If you deployed it today, expecting "beats HODL by +523" — you'd be disappointed. A retail investor reading the headline number doesn't see the regime breakdown. We just published it without the context.
That's the gap the reader was pointing at. And he was right.
Why HODL Still Stays as the Anchor
Before I explain what we're adding, let me defend why HODL doesn't get demoted.
1. Opportunity cost is universal.
Every dollar in your bot is a dollar that's not in HODL. The comparison must happen on the same capital, over the same period. If HODL would have produced $80k from $10k over 8 years, and your bot produced $50k, your bot is strictly worse for that capital. Doesn't matter if it traded once a year or 100 times. Wealth is wealth.
2. Fees and taxes accumulate.
A high-frequency bot pays per-trade fees on every entry and exit. 50 trades a year at 0.1% each = 10% per year of fee drag. Over 8 years compounded, that's enormous.
In Switzerland, monthly+ rotation can push you into "professional trading" tax classification (gains taxed up to 40%+). HODL avoids this entirely.
These costs only show up over long horizons. Short windows hide them. Long-window HODL comparison surfaces them.
3. We need long windows for statistical reliability.
Splitting an 8-year backtest into three independent regime-windows gives us three data points. Splitting into 50 short windows gives more observations but each is too noisy to be informative. Long-window comparison stays the foundation.
So HODL stays. But it gets company.
What We're Adding To The Picture
For each bot we now track and report multiple metrics, not just total return:
Beat-rate over rolling years. Instead of just "+523% total," we ask: in a randomly chosen 12-month period from the backtest, how often did the bot beat HODL? If the answer is 75%, that's three years out of four. If 50%, it's coin-flip. Big difference, even with the same total return.
Stability of returns. Picture two bots that both ended +200% after 8 years. Bot A delivered it in small steady steps — you could have slept through the whole run. Bot B got there via wild swings, spending months at -40% before clawing back. Same final number. Completely different experience. Nobody tells you the difference from the headline; the "Stark / Solide / OK / Schwach" label on our bot cards does. The technical name is Sharpe ratio.
Return per pain. How much yearly return did the bot deliver for each unit of worst-loss along the way? A bot returning 50% per year with -20% max drawdown is miles better than one returning 50% per year with -70% drawdown. Same headline number, very different stomach requirement. This is what Calmar ratio measures — we show it on the bot cards as "return-vs-pain," higher is better.
Walk-forward. Did the bot beat HODL in each of three independent historical periods, or did it win one big and lose the others? This catches strategies that worked in one regime and not others.
These four metrics, together with total return and max drawdown, give the multi-dimensional picture. A bot has to be good across them, not just on one.
Different Bots, Different Metrics That Matter Most
Not every metric matters equally for every bot. Rough rule:
The Watchdog (cycle filter, ~1 trade/year): Total return matters most. Win rate is meaningless with 1 trade per year.
Tactician 2.0 (daily momentum, 50 trades/year): Walk-forward consistency matters most. If it only worked in one regime, deployment is risky.
The Rotator and Tri-Rotator (cross-asset rotation, ~1 trade/week): Stability ratio matters most. They're capturing rotation premiums; we want smooth not lottery.
The Volcano (rare big trades, 6/year): Return-per-pain matters most. Six trades a year, low total return, but very low drawdowns — that's its profile.
The Alpha Hunter (US stock momentum, ~12 trades/year): Beating SPY (its sector benchmark) matters more than beating BTC HODL.
For each Bot Card on /bots, we now show the metrics that matter for THAT bot's strategy class. No more one-size-fits-all judgment.
What Changed Concretely
Three things shipped with this article:
1. The /methodology page explains the three tests every strategy must pass plus the multi-metric framework. One source of truth, linkable from anywhere.
2. Bot Cards extended. Each Live Performance Card now shows the multi-metric panel under the simple headline numbers. Want the technical raw values (Sharpe, Calmar)? Click to expand. Want plain-language judgments? They're on by default.
3. This article. Public discussion of the trade-off. Linked from /methodology and Bot Cards so readers who wonder "why is this bot here if it lost to HODL last year?" get the full answer.
The Sharper Position
Before this week my position was:
"Beat HODL after fees over the full backtest window or you don't have a strategy."
That's still mostly correct. The strict version stays as the necessary first filter. It kills 90%+ of garbage strategies on its own.
But the more nuanced version is:
"The HODL comparison over the full window is the necessary first filter. Strategies that pass it deserve a multi-metric evaluation that captures risk profile, regime consistency, and how they perform in average years. Some strategies that narrowly underperform HODL on total return can still be valuable in a portfolio context — if they have dramatically lower drawdowns, low correlation with HODL, or other risk-management properties that justify the trade-off."
Both versions are now public. The first version still applies for the rejection filter. The second version applies for what you actually deploy with. They work together.
What This Means For You
When you evaluate a trading strategy — ours, your own, anyone else's — here are the questions in order:
- Did it beat HODL after fees over the longest available data? If no, ask yourself why you'd pay it your time and risk. Most strategies stop here.
- Does it pass the regime test? Strategies that won big in one window and failed others are over-fit to that window.
- Does it work across nearby parameter values? If only one specific number works (lookback 14d) and the neighbors (13d, 15d) don't — you've found a lottery ticket, not an edge.
- What's the risk-adjusted return? Total return divided by max drawdown. Higher is better.
- In how many average years did it beat HODL? If it's 75%, the bot is a workhorse. If 50%, it's coin-flip.
- What does the strategy do in the regime we're currently in? Walk-forward windows tell you this.
If you only check #1, you're using the right anchor but missing 80% of the picture. If you skip #1, you're chasing a story without a baseline.
The right move is both. Anchor + complementary metrics. That's what the methodology page and Bot Cards now support.
Related reading:
- Methodology page — Three tests + multi-metric framework
- Beat HODL or Don't Bother — The strict HODL filter, defended
- Live ≠ Backtest — Why even good backtests can mislead live
- Parameter Robustness — Why parameter neighborhoods matter
- The Tactician 2.0 — Active example: backtest predicts it underperforms its peers, we run it live to verify
Not financial advice. Multi-metric reporting reduces — but does not eliminate — the chance of being misled by any single number.


